There are multiple way’s of configuring High Availablity on a set of Cisco ASA firewalls.
One of them is clustering (Note that Active/Standby or Active/Active is not the same as a ASA Cluster)
As of now there is no way to monitor the cluster status using SNMP, the only way to check if your ASA cluster is up and running is by monitoring your interface status.
If the data interfaces of a single ASA change to a disconnected state you know something has gone wrong in your cluster.
However I wanted more, after contacting TAC they confirmed that there still is no way of monitoring the ASA cluster with SNMP so I had to find a different way.
Most I wanted is shown when you run the ‘show cluster info’ command from the system context (if you use contexts), so to monitor the ASA cluster status with Nagios all I needed was a output from this command.
For this I created two simple scripts (one in batch, the other in expect) to login with SSH and run the show cluster info command.
Now this is absolutely not the best way of monitoring, and as you need to provide the password somewhere in Nagios it is not the most secure way but it works and especially in a development environment it is a good way of knowing when something has gone wrong in the ASA cluster.
For this you need the two scripts and some modifications to your nagios setup (nagios core in my case), so download the following files:
1) Download both files and put then in your nagios libexec folder (/usr/local/nagios/libexec in my setup):
1
2
3
| cd /usr/local/nagios/libexec/
wget https://raw.githubusercontent.com/darky83/Scripts/master/Nagios/ASA-Cluster-Status/check_asa_cluster.bash
wget https://raw.githubusercontent.com/darky83/Scripts/master/Nagios/ASA-Cluster-Status/check_asa_cluster.exp |
cd /usr/local/nagios/libexec/
wget https://raw.githubusercontent.com/darky83/Scripts/master/Nagios/ASA-Cluster-Status/check_asa_cluster.bash
wget https://raw.githubusercontent.com/darky83/Scripts/master/Nagios/ASA-Cluster-Status/check_asa_cluster.exp
2) Make the files executable:
1
| chmod 755 check_asa_cluster.* |
chmod 755 check_asa_cluster.*
3) Edit nagios templates.cfg and add a new service, in my case I check only every 6 hours, no need to bash the ASA with ssh logins as long as we get a notification if something goes wrong once a day, so edit your templates.cfg and add the following section at the bottom.
1
2
3
4
5
6
7
| define service{
name asa-cluster-service
use generic-service
normal_check_interval 360
retry_check_interval 10
register 0
} |
	define service{
        	name                            asa-cluster-service
	        use                             generic-service
	        normal_check_interval           360
	        retry_check_interval            10
	        register                        0
        }
4) Add a new asa cluster test command in your commands.cfg file:
1
2
3
4
5
| # ASA Cluster test
define command{
command_name check_asa_cluster
command_line $USER1$/check_asa_cluster.bash -H $HOSTADDRESS$ -U $ARG1$ -P $ARG2$ -M $ARG3$
} |
	# ASA Cluster test
	define command{
        	command_name    check_asa_cluster
	        command_line    $USER1$/check_asa_cluster.bash -H $HOSTADDRESS$ -U $ARG1$ -P $ARG2$ -M $ARG3$
	}
5) Add a new check somewhere in your host definition, note to change the hostname, ssh username, password and mode:
1
2
3
4
5
6
7
| # Cisco ASA Cluster status
define service{
use asa-cluster-service
host_name HOSTNAME_CHANGEME
service_description Cisco ASA Cluster Status
check_command check_asa_cluster!USERNAME_CHANGEME!PASSWORD_CHANGEME!MODE_CHANGEME
} |
        # Cisco ASA Cluster status
	define service{
	        use                     asa-cluster-service
	        host_name               HOSTNAME_CHANGEME
	        service_description     Cisco ASA Cluster Status
	        check_command           check_asa_cluster!USERNAME_CHANGEME!PASSWORD_CHANGEME!MODE_CHANGEME
        }
The mode is a 0 if the monitored unit should be the cluster Master and a 1 if the unit should be a cluster slave, this way you can check if your cluster master status changes to another unit.
Hopefully Cisco will add support for ASA Clustering status monitoring in SNMP sometime soon so we won’t need workarounds anymore.
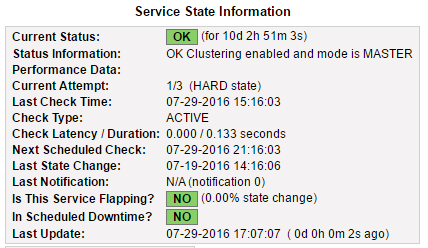
Status OK and the configured unit should be the master:

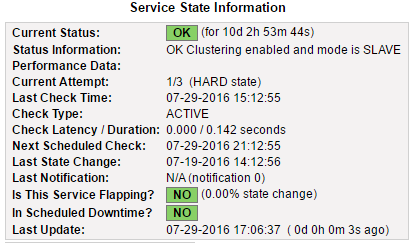
Status OK and the configured unit should be a slave:

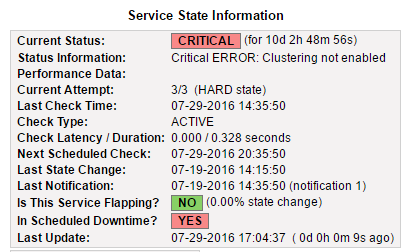
Status Critical when clustering is not enabled: